We start by examining July's market trends, noting a peak around the eighth trading day. This pattern, often seen in pre-election years and in the NASDAQ, hints at a possible market pivot.
Next, we discuss the recent CPI report. Initially, the market surged as the report was lower than expected, but later began to sink. Interestingly, utilities, a rate-sensitive sector, led the way, possibly due to a significant decrease in two-year and ten-year rates post-CPI report.
We also touch on inflation data, which came in at 3% year over year, lower than the consensus and the CPI nowcast by the Federal Reserve. This underperformance was perceived positively by the market.
The Fed Watch tool suggests a 94% chance of a rate hike in the July meeting, but a decreased probability for September, indicating a potential pause in rate hikes.
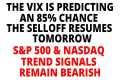
Lastly, we highlight the significant drop in the dollar and its impact on various sectors. We also discuss the S&P 500 and the NASDAQ, both trading outside of their weekly expected moves. However, the big mega cap names, which have a large weighting in the S&P 500 and NASDAQ 100, have not moved outside of their expected moves, which could potentially alleviate the market even if some products fall.
In conclusion, while signs of a potential market pivot are emerging, it's crucial to monitor the big mega cap names and be prepared for various scenarios. Stay tuned for more updates!
High Volatility Scan: ○ https://youtu.be/VC327ko8DfE ______________________________________________________________________________________________ DISCLAIMER: I am not a professional investment advisor, nor do I claim to be. All my videos are for entertainment and educational purposes only. This is not trading advice. I am wrong all the time. Everything you watch on my channel is my opinion. Links included in this description might be affiliate links. If you purchase a product or service with the links that I provide I may receive a small commission. There is no additional charge to you! Thank you for supporting my channel :)